case study | medical |
Extreme Meshing Helps Resolve Heart Stent Complications by Kara Gray Heart disease, often caused by partially-blocked coronary arteries, is the most common cause of death in the world. With more than one million coronary stent procedures performed in the United States each year, stenting has become one of the most popular forms of treatment to open these plaque-encrusted atherosclerotic coronary arteries. However, stenting does not always provide permanent relief from arterial blockage. According to the American Heart Association, about 1 in 4 stent patients will experience restenosis, a repeated narrowing of the stented artery, within 3 to 6 months following the procedure. Restenosis requires some patients to undergo a second stenting procedure to alleviate the subsequent blockage, increasing their risk for arterial damage and further complications from the unnatural pressure exerted on the artery. For others, a full bypass operation is the only solution. Two engineers and a cadet from the Virginia Military Institute are using cutting-edge computer animation software from CEI to help identify a possible cause and find solutions that might help reduce the risk of restenosis for hundreds of patients. Stress-related restenosis VMIs Matthew R. Hyre, P.E., Ph.D., James C. Squire, P.E., Ph.D., and cadet Raevon Pulliam, theorized that this restenosis may be the result of arterial injury incurred during the stenting procedure itself. During the procedure, a balloon, sheathed by the stent, is inserted into the artery and inflated. Once the stent expands, the balloon is deflated and removed, leaving the stent in place. One reason you can get damage is from end flare, caused by the little bit of overhang of the balloon at the end of the stent maybe 1 mm on each end, Hyre says. As the balloon expands the stent, the ends expand faster, causing a flare at one or both ends. This exerts increased pressure on the arterial wall and may scrape it during inflation, which could stimulate uncontrolled cell growth in that area. If the balloon slips inside the stent at all during the procedure, the problem could be exacerbated, creating even greater stress on the arterial wall where the balloon and stent jut into the tissue. Hyre and Squire, along with Pulliam, discovered a way to predict this end flare, and the resulting arterial stresses, to help stent and balloon manufacturers improve their products and reduce this phenomenon. The most difficult part of the problem, from a numerical perspective, is that the balloon is very thin, with the elasticity varying axially because of how it is mounted to the catheter. Additionally, its mechanical properties will vary dramatically during the expansion process, Hyre says. It starts off very soft, then gets very hard when it nears its final diameter. It is at this point when the nonlinear stent expansion starts. This makes the problem very numerically unstable. How you mesh the structure of the balloon, the stent, and the artery become very critical to being able to solve the problem. Meshing the stent and beyond Hyre used Harpoon, Sharcs extreme meshing software, to generate the complex mesh. Because the stent expands from 1 mm to 3 mm, a numerically very large expansion, it required the creation of an extremely complex mesh, one that must follow the balloon, stent and artery all the way through the expansion process.Harpoon was really nice to work with, allowing me to create a combination of triangular shell elements and really nice hexes on an extremely complicated geometry, Hyre says. And, it only took about 1 minute to mesh this once the geometry was imported into the program, compared to 45 min. to an hour with other meshing software. It just flies on Harpoon. This is an incredible efficiency, allowing researchers and manufacturers to test various scenarios, make adjustments to the model, re-run the script and view the results. The only delay is in the solution time for the analysis. There are, after all, more than one trillion operations required in order to test each scenario. From model to market Using these advanced tools, the overall turnaround time is dramatically reduced from days and weeks to a few hours. This analytical efficiency may even reduce the time it takes to get new and improved products to the market.It could be three years between the time the simulation is done and the time that those results yield an improved device available on the market, Squire says. It sounds like a long time, but this technology may allow you to save time in the required FDA approval process. Given the number of patients affected by heart disease, any reduction in the rate of restenosis could dramatically improve the prognosis for hundreds of patients each year. By figuring out the biomechanical basis for the arterial injury that causes the problem, Hyre and Squire say there is no reason restenosis rates can not be mitigated to a number that is arbitrarily low. When youre talking about a million stent procedures annually, 5 to 10 percent is significant, Squire says. This technology could allow us to reduce that rate dramatically.
|
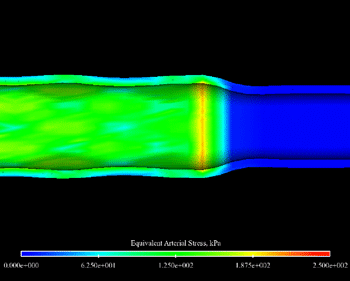
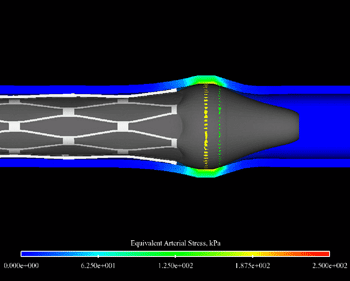
The artery post-inflation showing the point of peak arterial stress. The red ring indicates the high stress caused by the end flare that occurred during inflation. This image depicts the point of maximum end flare during the inflation of the balloon and stent during the stenting process, and offers physicians and manufacturers a glimpse at just how badly the balloon and end flare can get during expansion.
|